---
title: "The Netherlands Mostly Uses AI at Home"
author: Marc Diks
date: 2026-08-22
modified: 2026-08-22
category: AI Strategy
reading_time: 10 min
url: https://www.marcdiks.nl/en/blog/netherlands-uses-ai-mostly-at-home
canonical: https://www.marcdiks.nl/en/blog/netherlands-uses-ai-mostly-at-home
language: en
---
# The Netherlands Mostly Uses AI at Home
*The Anthropic Economic Index shows what Dutch people actually use an AI model for. The figures aren't what the adoption numbers tell you.*
> **TL;DR**
>
> - The Netherlands ranks **11th of 121 countries** in AI use, with an index of 3.9. We use nearly four times as much as you'd expect based on population size alone.
> - Yet **44.5 percent** of Dutch conversations are about personal matters and only 40.8 percent about work. Globally, that ratio is exactly reversed.
> - Businesses lag behind: only **22.7 percent** of companies with ten or more employees used AI in 2024, and only 15 percent of AI projects actually get rolled out.
> - AI hasn't become the spell-checker. Proofreading is 0.67 percent of conversations, writing business email 2.49 percent. **The model writes the first draft, the human corrects it.**
> - Those exact business texts (7.13 percent of all conversations) get a machine-readable mark under **Article 50 of the EU AI Act**.
> - The gap isn't laziness but regulatory friction: GDPR, security, the AI Act and DORA cost weeks per tool, and an individual doesn't have that step.
Last week I looked up where the Netherlands stands in the Anthropic Economic Index, and two figures stuck with me. Of all Dutch conversations with Claude, 44.5 percent are about personal matters and 40.8 percent about work. Globally, that ratio is exactly reversed.
That looks like a detail, but it clashes with what Statistics Netherlands (CBS) measures: in 2024, 22.7 percent of Dutch companies with ten or more employees used AI technology. People, in other words, are ahead of the organisations they work for.
## What these figures are and aren't
Anthropic's [Economic Index](https://www.anthropic.com/economic-index) isn't a survey. Nobody was asked whether they use AI. It looks at what the conversations were actually about.
Those conversations were then mapped onto O\*NET, a public American database listing which tasks belong to which occupation. For an insurance advisor, for example, it lists "answering customer questions" and "comparing policies." That lets you see what kind of work people hand to a model, without knowing who those people are.
That's more honest than letting people describe their own behaviour. It's also more limited, because there's no user characteristic in it at all. Age, gender, education and company size are all absent. You see what's being asked, but not by whom.
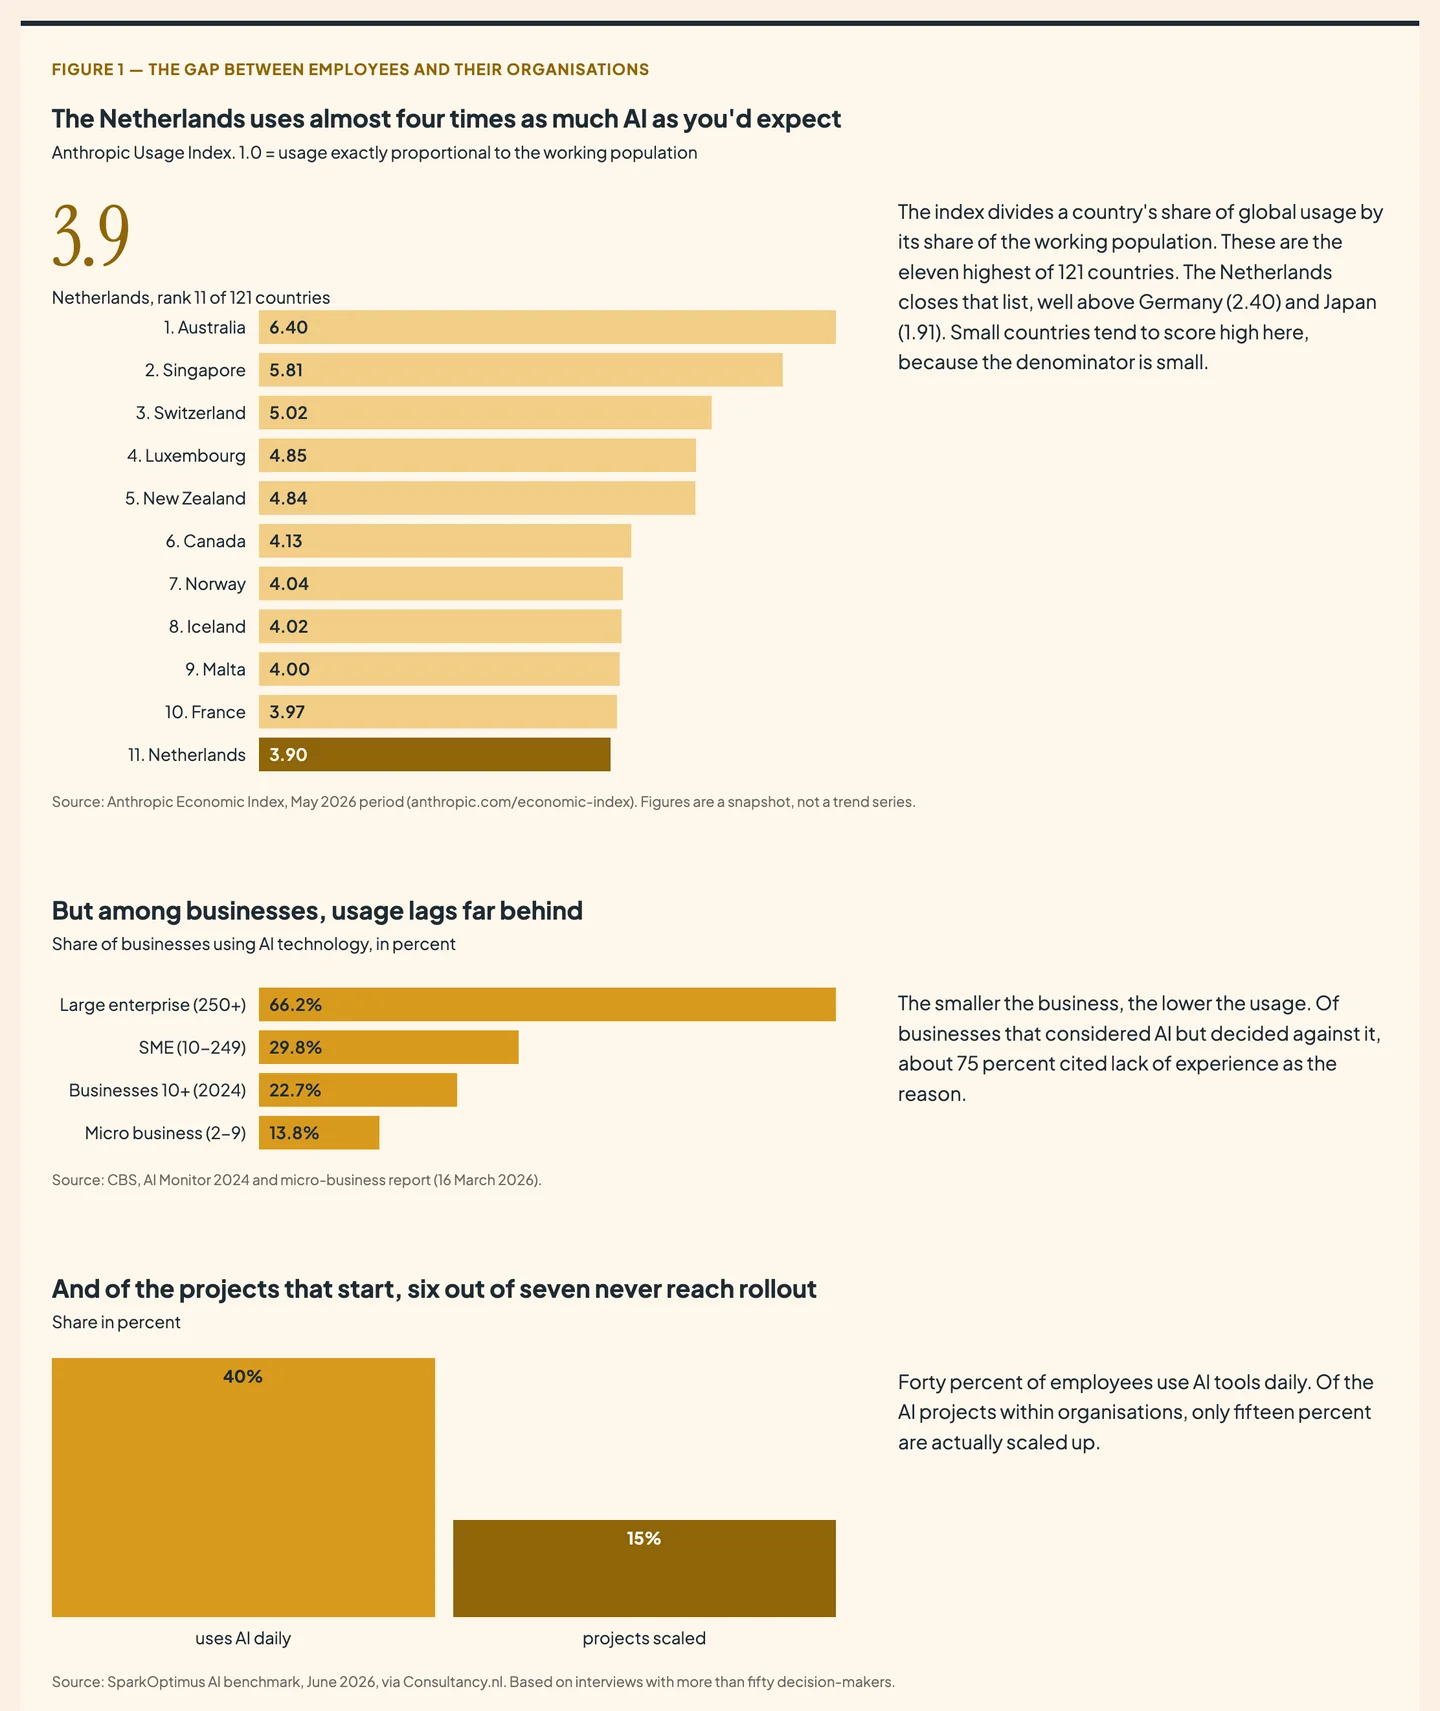
In these figures, the Netherlands ranks 11th of 121 countries. That comes from the usage index, which works like this: you take a country's share of all global usage and divide it by that country's share of the global working population. A result of 1.0 means a country uses exactly as much AI as you'd expect from its population. A result of 2.0 means twice as much.
The Netherlands sits at 3.9. So we use nearly four times as much as you'd expect. Germany is at 2.4, Spain at 2.7 and Japan at 1.9. Australia tops the list at 6.4.
Figure 1 — The gap between the employee and the organisation. Sources: Anthropic Economic Index (May 2026), CBS AI monitor 2024, SparkOptimus benchmark June 2026.
## The figure that surprised me most
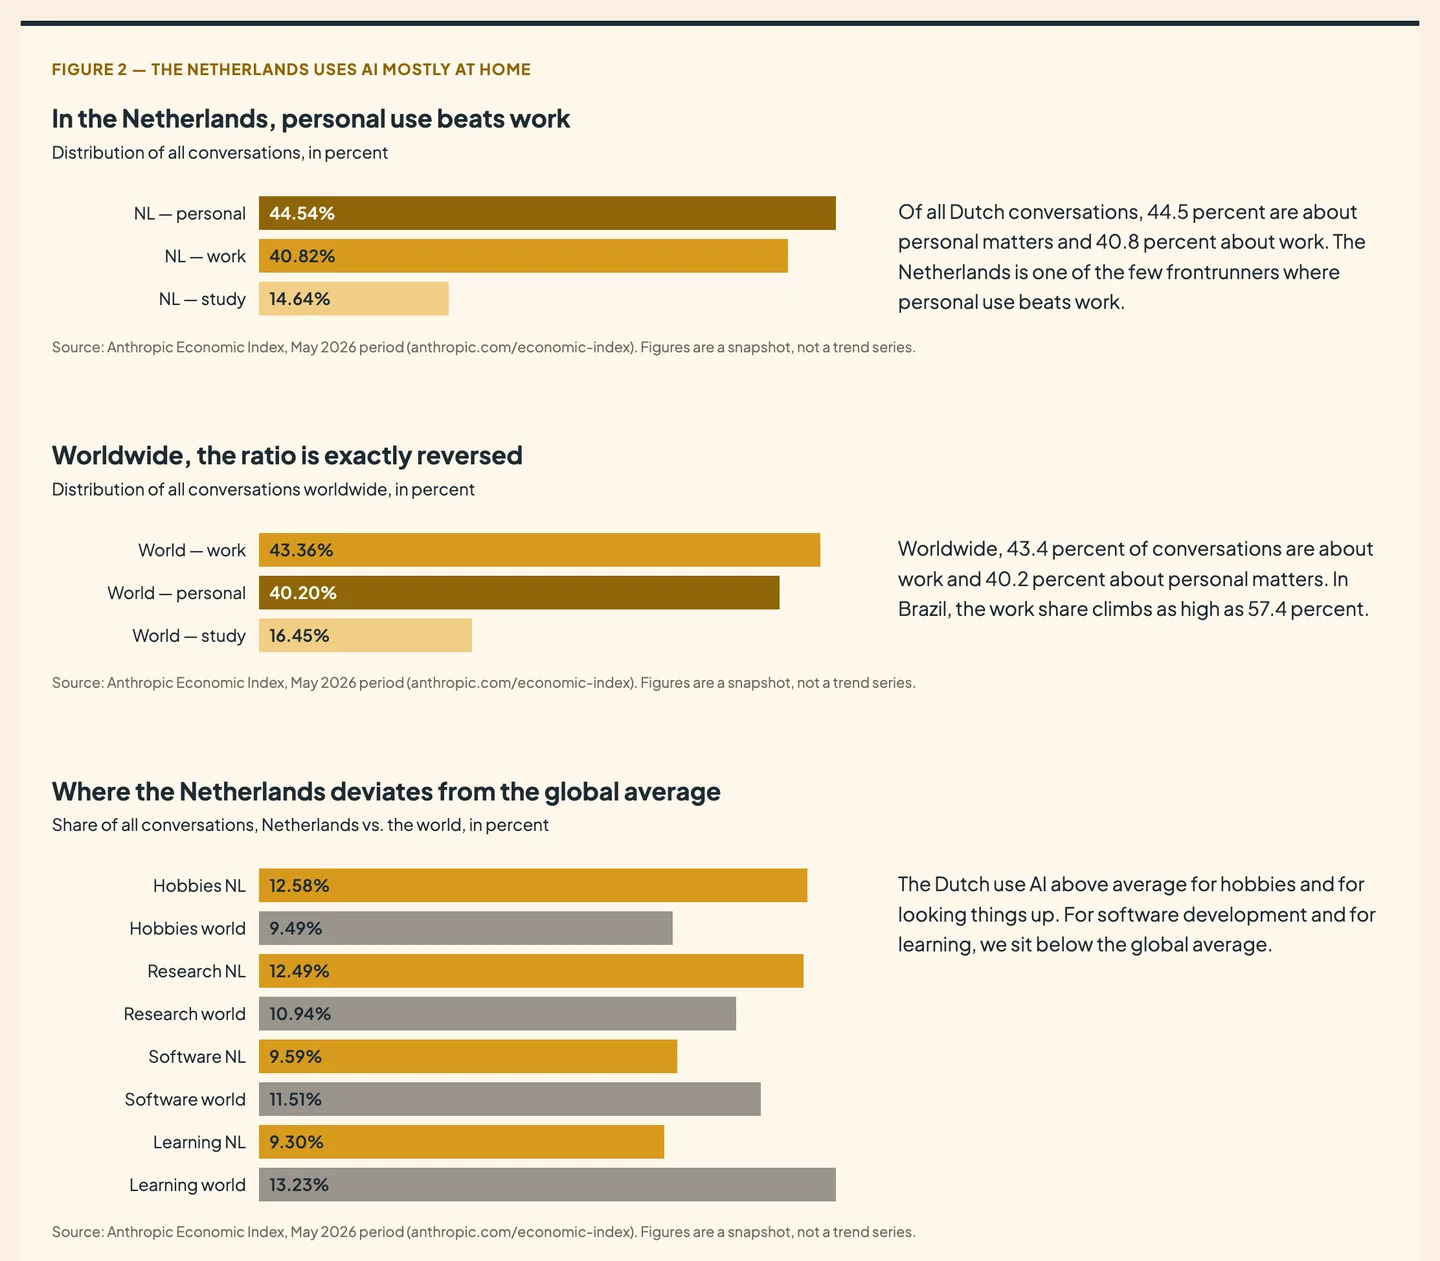
Globally, 43.4 percent of conversations are about work, 40.2 percent personal and 16.5 percent study. In the Netherlands that's 40.8 percent work, 44.5 percent personal and 14.6 percent study.
So the Netherlands is one of the few frontrunners where personal use beats work use. In Brazil, 57.4 percent of usage is work-related, in the United Arab Emirates 54.6 percent and in Israel 53.3 percent. We use it a lot, but mostly outside the office.
You see it reflected in the topics. Hobbies and lifestyle make up 12.58 percent of all our conversations, against 9.49 percent globally — a third above average. Within that sit cooking (1.50 percent), home renovation (0.90 percent), gaming (1.06 percent), training schedules (0.70 percent) and gardening (0.38 percent). Research and comparison sits at 12.49 percent against 10.94 globally, with investment questions and product comparisons as the largest items.
The other side is just as clear. Software development is 9.59 percent for us against 11.51 percent globally, and learning and education 9.30 against 13.23 percent. So we build less with it, and we learn less with it, than the rest of the world.
Figure 2 — The Netherlands mostly uses AI at home. Source: Anthropic Economic Index, May 2026 period.
## What we actually ask for
Writing text is the largest topic at 22.51 percent, nearly matching the global average of 22.72 percent. The breakdown is more interesting than that total, because the dataset goes three levels deep.
In conversations about AI at work, I've heard the same reassurance for two years now: that people mainly use it to polish up their own text. A spell-checker with extra brains. The figures don't back that up.
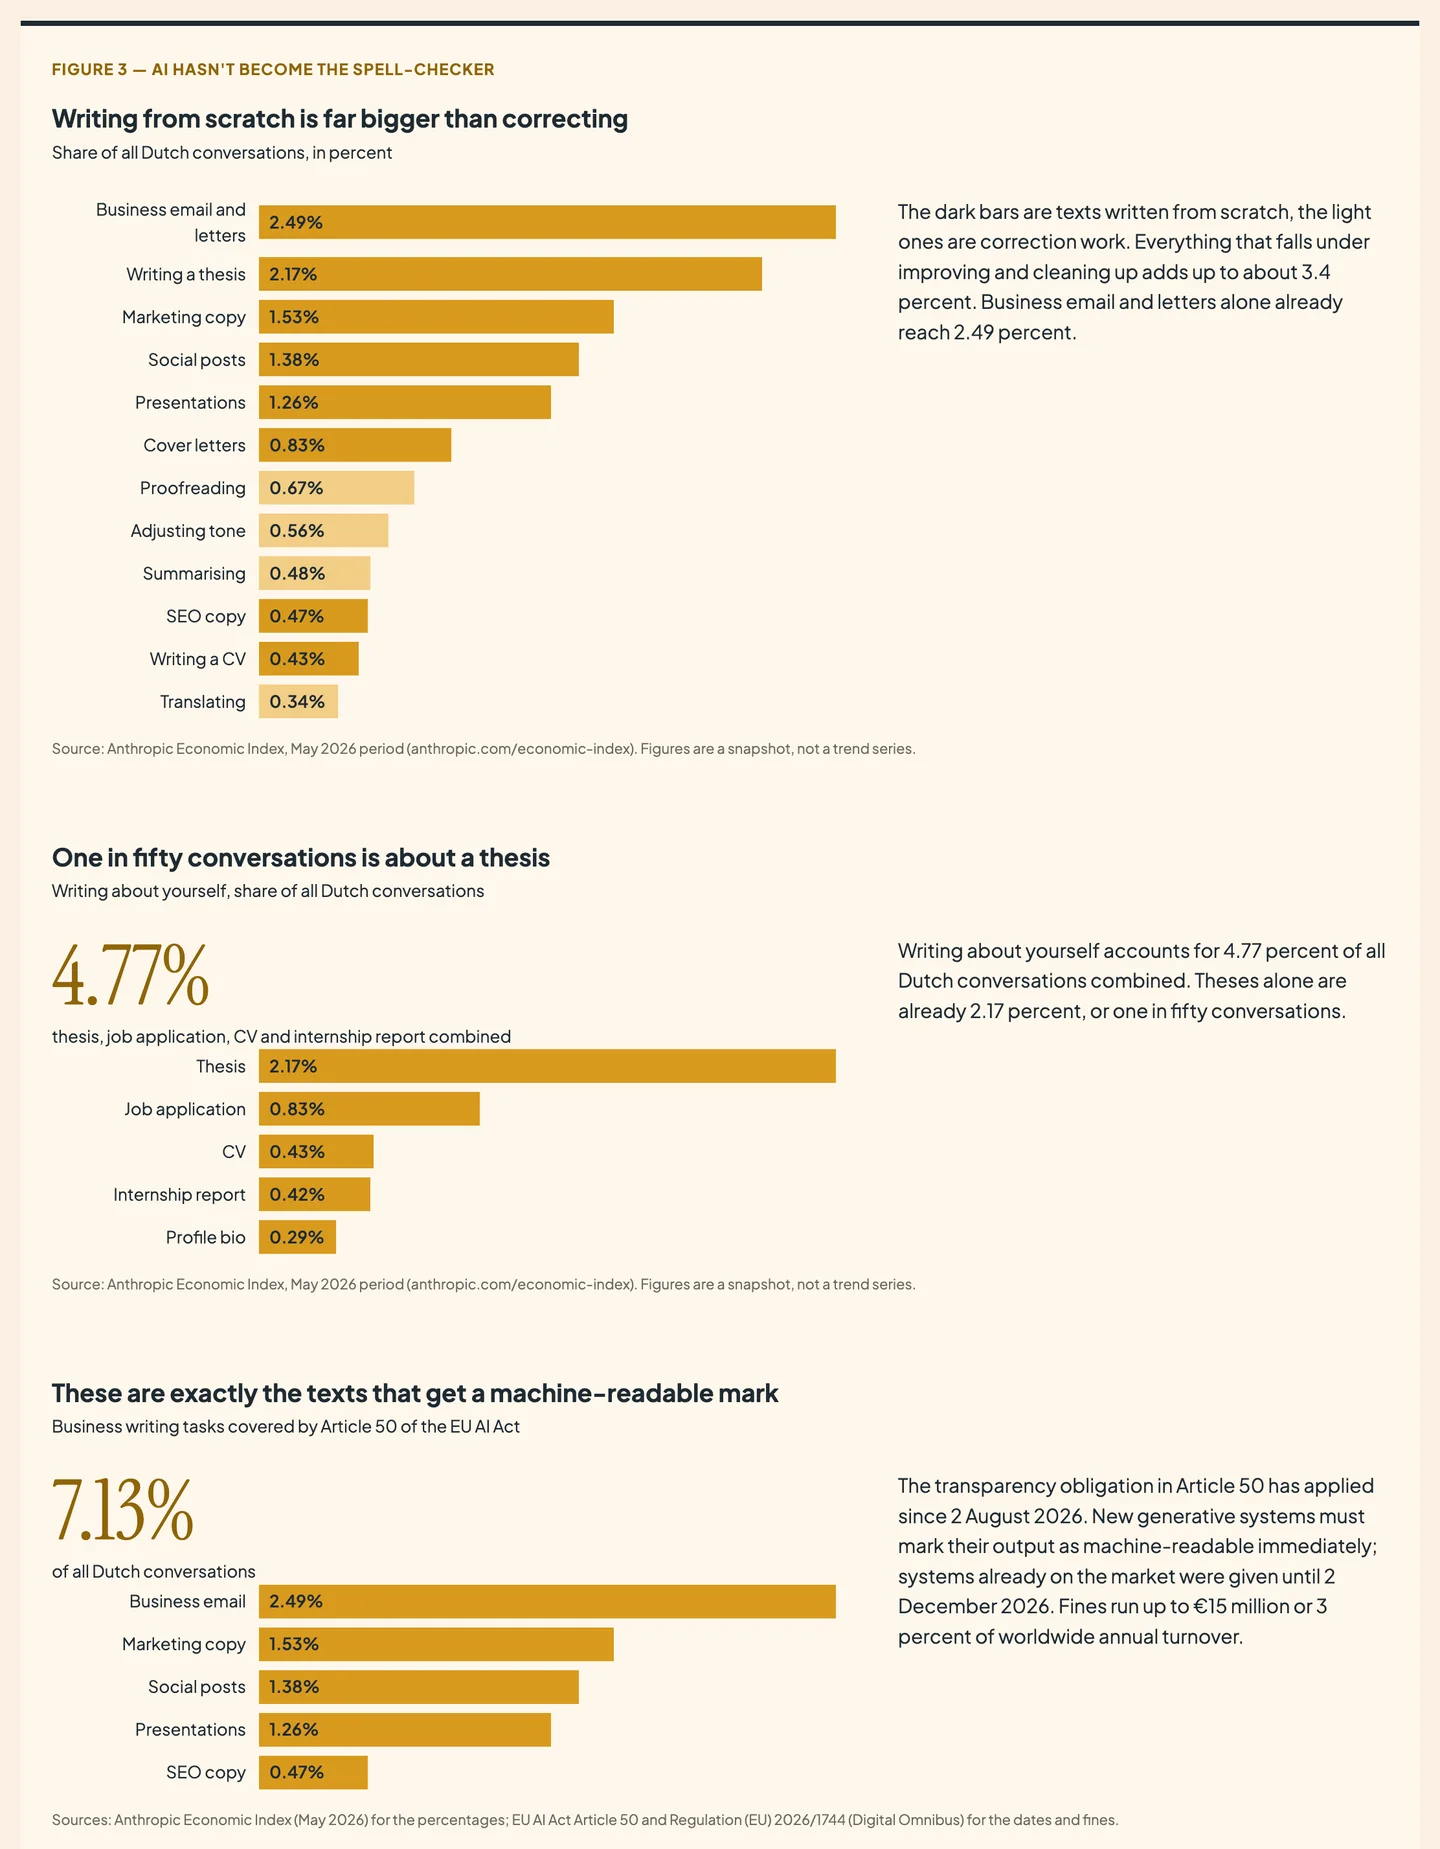
Proofreading is 0.67 percent of all Dutch conversations, translating 0.34 percent, summarising 0.48 percent and adjusting tone 0.56 percent. Everything you'd file under improving and cleaning up adds up to roughly 3.4 percent.
Business email and letters alone already account for 2.49 percent. Marketing copy is at 1.53 percent, social posts 1.38 percent, presentations 1.26 percent and SEO copy 0.47 percent. And then the category I find most surprising: writing about yourself totals 4.77 percent, with theses (2.17 percent), cover letters (0.83 percent), CVs (0.43 percent) and internship reports (0.42 percent).
That thesis figure means one in fifty Dutch conversations with this model is about a thesis. For a single dataset covering a single month, I find that a lot.
So the model writes the first draft and the human does the correction pass afterward. Most organisations have their policy set up in exactly the reverse order.
### These exact texts are about to get a watermark
Look again at that list: email, marketing copy, social posts, presentations, SEO copy. That's precisely the content covered by Article 50 of the [EU AI Act](/en/blog/eu-ai-act-delay-failed-may-2026).
Since August 2, 2026, the transparency obligation from that article applies. Anyone deploying a chatbot has to say it's a chatbot. Deepfakes and AI-generated text about matters of public interest must be visibly disclosed. Fines run up to 15 million euros or 3 percent of global annual turnover.
The part that will affect most people is paragraph 2: the machine-readable marking. Models must embed their own output with a mark a computer can recognise, even if you can't see it yourself. New generative systems had to have that on board from August 2, 2026. Systems that already existed got an extension until December 2, 2026.
That obligation sits with the provider of the model, not with you as the writer. But that's exactly the point. It happens automatically, in the output, on precisely that 7.13 percent of business text we discussed above. I wrote earlier about [how SynthID and C2PA do that technically](/en/blog/synthid-c2pa-insurance-fraud-what-actually-works).
As far as I'm concerned, that's the most important lesson from these figures for the coming year. If your organisation makes agreements about AI and text, those agreements are no longer just about quality. They're about what's sitting inside your documents that someone else can read out.
Figure 3 — AI hasn't become the spell-checker. Sources: Anthropic Economic Index (May 2026); EU AI Act Article 50.
## Eleven provinces, eleven stories
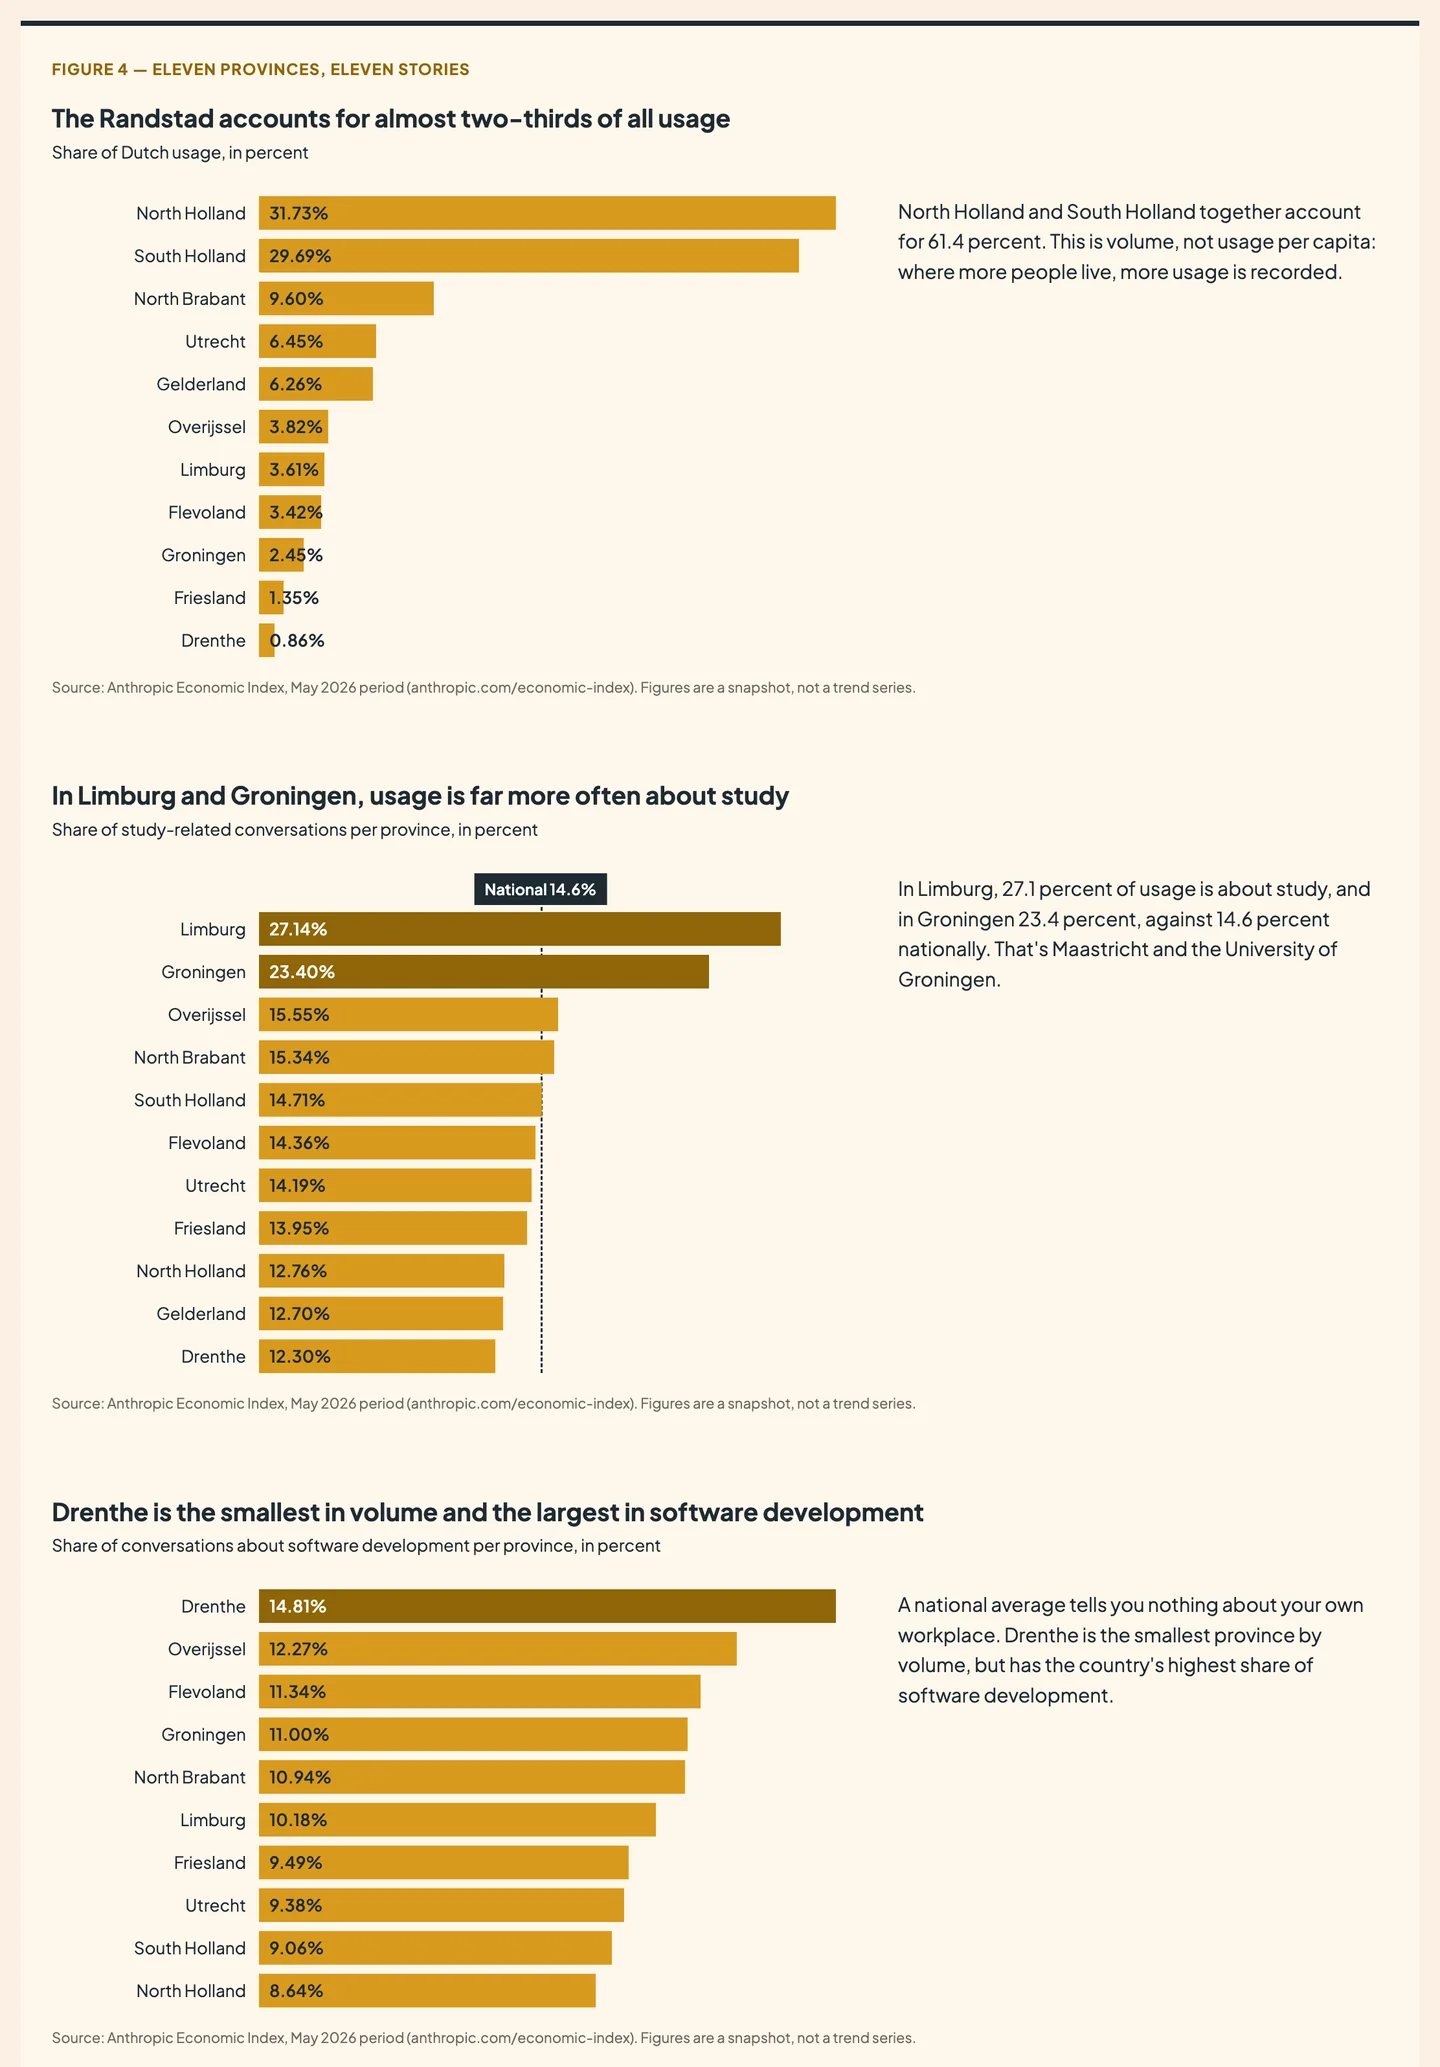
For the first time there are also figures by province. Pay attention to what they do and don't say. This is about each province's share of Dutch usage, not usage per resident. North Holland tops the list simply because a lot of people live there.
North Holland and South Holland together account for 61.4 percent of all Dutch usage. North Brabant follows with 9.6 percent, then Utrecht (6.45), Gelderland (6.26), Overijssel (3.82), Limburg (3.61), Flevoland (3.42), Groningen (2.45), Fryslân (1.35) and Drenthe (0.86).
The split within each province says more than the volume. In Limburg, 27.1 percent of usage is about study, and in Groningen 23.4 percent, against 14.6 percent nationally — that's Maastricht and the University of Groningen. Gelderland is the most work-focused, at 45.3 percent.
And then an outlier I didn't see coming. Drenthe is the smallest province by volume, but has the country's highest share of software development at 14.81 percent. North Holland doesn't get past 8.64 percent. Overijssel has the most technical and mathematical tasks at 27.02 percent. Fryslân writes the most, with 25.76 percent text work.
For the main question of this piece, that changes little. What it does show is that a national average tells you nothing about your own workplace. You have to check that yourself.
Figure 4 — Eleven provinces, eleven stories. Source: Anthropic Economic Index, May 2026 period.
## Why this is a governance problem
When I put the two sources side by side, it gets uncomfortable.
On one hand, the Netherlands ranks 11th of 121 countries, with an index of 3.9. On the other, CBS measures that in 2024, [22.7 percent of companies with ten or more employees](https://www.cbs.nl/nl-nl/longread/aanvullende-statistische-diensten/2025/ai-monitor-2024/2-gebruik-van-ai-technologie-door-nederlandse-bedrijven) used AI technology. In 2025 that was [13.8 percent for micro-companies and 66.2 percent for large enterprises](https://www.cbs.nl/nl-nl/longread/rapportages/2026/gebruik-van-ai-technologie-door-nederlandse-microbedrijven).
The [SparkOptimus benchmark from June 2026](https://www.consultancy.nl/nieuws/68346/sparkoptimus-meeste-bedrijven-worstelen-met-opschalen-van-ai-ondanks-snelle-adoptie) shows that 40 percent of employees use AI tools daily, while only 15 percent of AI projects actually get rolled out. That comes from conversations with just over fifty decision-makers, so it isn't a representative sample. The direction is clear enough.
I want to be honest about the weak spot in this comparison. CBS measures whether a company deploys one of seven defined AI techniques. The Economic Index measures what conversations were about. Those are two different things, and you can't simply divide one by the other. But that difference is exactly the point. One measurement looks at what an organisation decides; the other at what people actually do.
I see in the market where that difference comes from. People try out tools themselves and build their own custom GPTs, for work and for home. Often with tools their organisation hasn't approved.
What strikes me as notable is that this is entirely logical. Anyone working in financial services has to run every new tool past the GDPR, a security review, the AI Act and, since January 2025, DORA too. On top of that comes the ordinary question of whether there's budget for it. That kind of assessment takes weeks. In those same weeks, a new version of the model appears, or a tool more interesting than the one still in review. An individual doesn't have that step, so they're always faster.
I wrote earlier that [blocking shadow AI doesn't work](/en/blog/shadow-ai-why-blocking-fails), and this is the figure underneath that claim. People don't wait for their organisation to have an AI strategy. They just use it, and if it can't happen at the office, it happens at home.
CBS asked companies that considered AI but never started what held them back. About 75 percent cited a lack of experience. That's a knowledge problem, not a money or technology problem, in a country whose population is among the most intensive users in the world. The knowledge is there, then — it just sits with the people, not in the procedure. That lines up with what I wrote earlier about [the blind spot in the boardroom](/en/blog/the-boardroom-blind-spot).
## What I'd do about it
I've spent two years building tools myself with Claude Code and Cursor, without being a developer. So I know from experience how fast the gap grows between what one person alone can pull off and what's formally agreed. Three things I'd do differently.
### 1. Don't ask whether people use AI, ask what for
An adoption percentage tells you almost nothing. The question that actually matters is which tasks you hand people over to a model. If it looks like it does in these figures, it isn't about correction work but about first drafts of email, presentations and text. That calls for agreements about who makes the second draft and who's responsible for what goes out the door. Choosing a tool doesn't solve that.
### 2. Bring the personal use inside
If 44.5 percent of Dutch usage is personal, then some of your people are building skills at home in the evening that you don't use during the day. That's a waste, and it's also a risk, because they're working without agreements on data and responsibility. I wrote earlier about the [four types of AI users in your organisation](/en/blog/four-ai-users-in-your-organization). The first step is still knowing who sits where.
### 3. Shorten the review, not the ambition
That only 15 percent of projects get rolled out is the figure that alarms me most. Not because pilots fail — that's normal — but because the review often takes longer than the tool itself lasts. As long as you start from zero every time with GDPR, security, the AI Act and DORA for every tool, the individual always wins. The way out, in my view, is a fixed route you set up once and then run through per tool.
## One more thing about these figures
I'm using a single dataset from a single provider, over a single month, with no data about the users. Anyone using ChatGPT, Gemini or Copilot isn't in it. So this isn't a cross-section of Dutch AI use, but of Dutch Claude use.
There's also no time series in it, so you can't read a rising or falling trend from it. Anthropic itself says so explicitly, and I stick to that. With numbers like these, the temptation to draw a line that isn't there is strong.
Even so, it's the most concrete source I know for what people actually use a language model for. The patterns are too pronounced to wave away. If your country ranks 11th of 121 and usage mostly happens at home, you no longer need to convince your people of AI. The only question left that matters is how long it takes at your place before something lands approved on their desk.
---
## Sources
* The full dataset, methodology and definitions: [Anthropic Economic Index](https://www.anthropic.com/economic-index)
* AI use by Dutch companies with ten or more employees: [CBS AI monitor 2024](https://www.cbs.nl/nl-nl/longread/aanvullende-statistische-diensten/2025/ai-monitor-2024/2-gebruik-van-ai-technologie-door-nederlandse-bedrijven)
* AI use by Dutch micro-companies, SMEs and large enterprises: [CBS, March 16, 2026](https://www.cbs.nl/nl-nl/longread/rapportages/2026/gebruik-van-ai-technologie-door-nederlandse-microbedrijven)
* Daily AI use by employees and the share of projects that get rolled out: [SparkOptimus benchmark via Consultancy.nl, June 22, 2026](https://www.consultancy.nl/nieuws/68346/sparkoptimus-meeste-bedrijven-worstelen-met-opschalen-van-ai-ondanks-snelle-adoptie)